01 / Sources
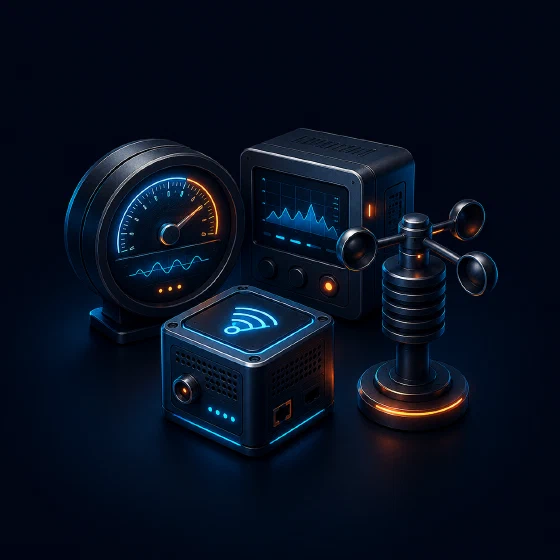
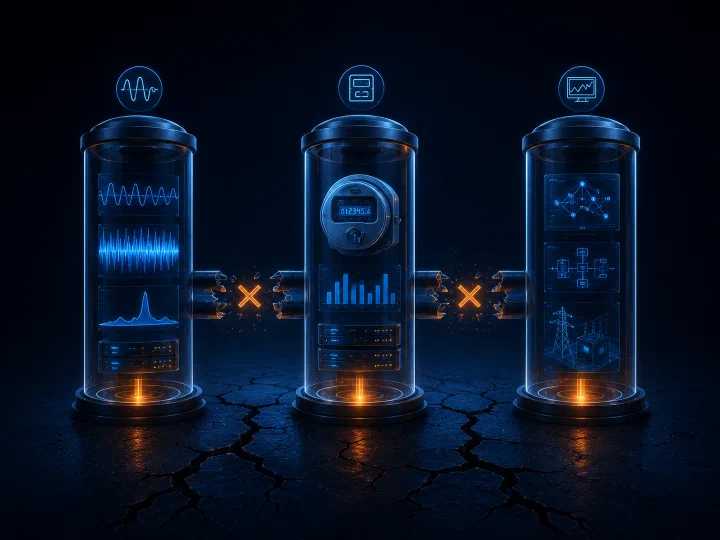
Sensor data
High-resolution and low-resolution measurements from the devices that observe physical systems.
AMIPMUSCADARelaysDFRPQ
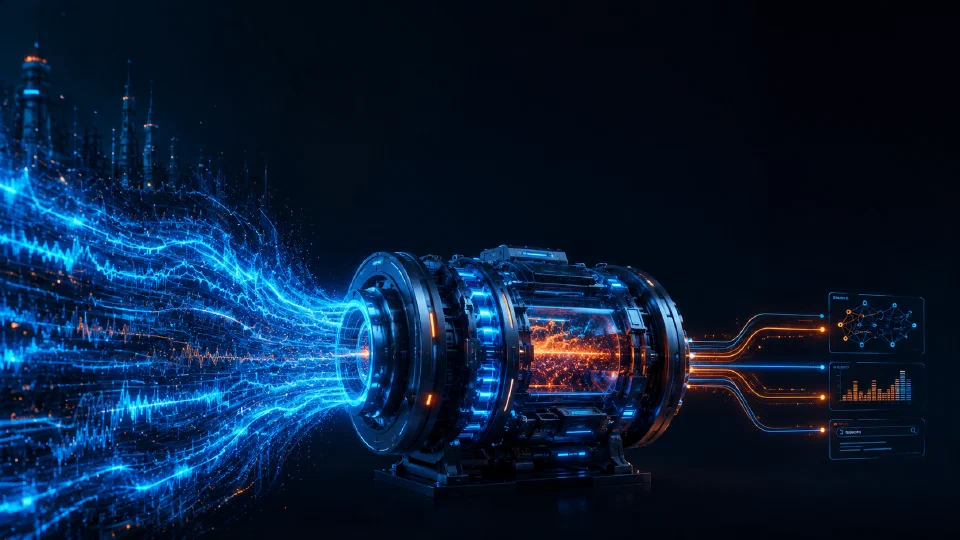
PingThings gives utilities, grid operators, and industrial teams one place to capture, preserve, contextualize, query, visualize, analyze, and build with sensor data from real-world infrastructure. The data foundation for engineering, operations, applications, and AI.
Physical systems do not produce one clean data type. PingThings brings those signals into one time-aware platform.
High-resolution and low-resolution measurements from the devices that observe physical systems.
The records and systems teams already use to understand assets, events, topology, and field work.
The outside signals needed to explain what the physical system was experiencing at the time.
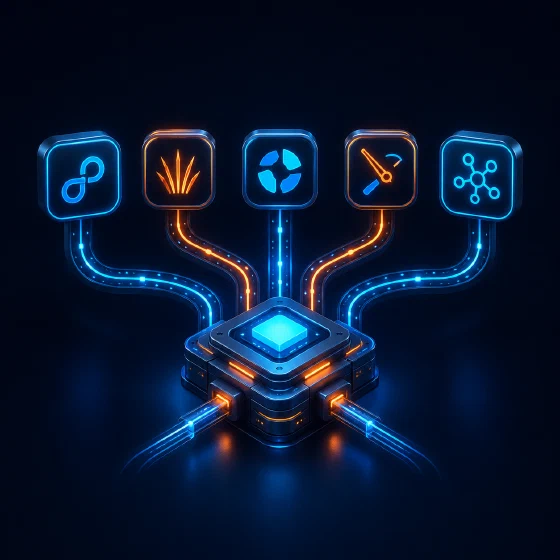
The derived streams, features, models, alerts, apps, dashboards, and reports built from the signal.
PingThings works across the dimensions that usually fragment physical-system data: any sensor, any vendor, any frequency, real-time or historical, continuous or discrete. Access is the first step. Making it usable is the advantage.
Ingest time series data from virtually any device, asset, physical system, historian, concentrator, external systems, virtual streams, or derived data.
Work across sensing hardware, protocols, vendors, and existing systems: a truly mixed-vendor platform where all hardware is treated equally.

Process virtually any frequency time series, from samples taken once an hour to millions of measurements per second per stream, in one platform.
Get millisecond access to both real-time and historical data as both are first class citizens in one platform.

Handle all types of time series, including continuous streaming values, discrete digital measurements, and even asynchronous events data.

Assets generate rich, high-resolution data. Most of it stays where it's produced.
Each type of sensor operates inside a proprietary, vertically integrated stack.

Legacy architectures make historical data slow, fragile, or unreachable.
Without history, physical systems cannot learn.
Existing architectures prevent intelligence from compounding across time and across fleets.
Why do you need high-resolution data?
At low resolution, everything looks stable. At high resolution, you see what is actually happening. Most systems store the summary. PingThings preserves the signal.
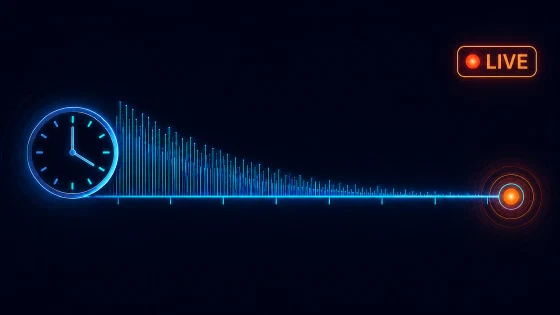
Why do we need historical data?
Most industrial systems optimize for real time. But real time alone is just a sliver. PingThings unifies live data, historical context, and predictive models so physical systems can be understood across past, present, and future.
Why does one shared data layer matter?
| The Legacy Way | The PingThings Way | |
|---|---|---|
| Data Resolution | Downsampled Lossy averages and summaries. Full fidelity discarded at ingestion to fit storage budgets. | Lossless Hi-def raw waveforms preserved indefinitely. Decades of data online at the resolution it was captured. |
| Forensics | "What happened today?" Investigations end at whatever the historian retained. Microsecond detail is gone before you ask for it. | "What happened at millisecond 42?" Sub-cycle inspection across years of archive. Reconstruct any moment, at any resolution. |
| AI / ML Potential | Limited training data Models train on summaries that destroyed the signal they were meant to learn from. | Massive, granular datasets Deep learning on the raw substrate. Models retrain on the same archive they predict over. |
| Maintenance | Reactive · schedule-based Equipment is replaced when it fails or when the manual says so. Failures arrive without warning. | Predictive · physics-based signatures Asset degradation surfaces in waveform signatures weeks before failure. Maintenance becomes a known event. |
| Architecture | Vendor silos Each system inside its own proprietary stack. Cross-correlation requires custom integration. | A single substrate Every sensor, every protocol, every sample rate. One query plane. Real-time and historical, indistinguishable. |
Major North American transmission, distribution, and generation utilities. ISOs and RTOs. National laboratories. University research consortia in power systems and grid AI.
Multi-million-channel deployments. Multi-year analytics horizons. One customer has been running PredictiveGrid at over 2 million measurements per second, 24/7/365, for more than five years. Each deployment runs in single-tenant cluster isolation, designed to operate inside customer NERC-CIP perimeters.
PredictiveGrid has been hardened in this vertical for nearly a decade. The architecture diagram above is what runs in production. The papers below are what powers it.
The storage engine and stream-processing framework underneath PredictiveGrid are not grid-specific. The algorithms make no assumption about what the timestamps describe. Any physical system whose behavior is defined by continuous, high-frequency sensor measurements at fleet scale is in scope.
We're actively talking to organizations in these adjacent domains. If you're building a measurement system at scale and the problems above sound familiar, the conversation is worth having.
AI on physical infrastructure is fundamentally different from AI on text or images. It runs on continuous, noisy, high-frequency signals, the kind of data legacy historians have been throwing away for decades.
Slow data is incompatible with running tomorrow's physical infrastructure. The sub-second dynamics that matter—the behavior of inverter-based resources, the precursors to equipment failure, the thermal signatures of a battery cell about to runaway, the vibration signature of a turbine bearing weeks from failure—only exist at high sample rates. PredictiveGrid was built to make those rates routine, queryable, and trainable on, at fleet scale.
When the data is preserved at the resolution physics happens at, the models that learn from it become qualitatively different. In the grid: equipment degradation surfaces in waveform signatures weeks before failure. In renewables: inverter-based resource behavior under weak-grid conditions becomes legible. In data center fleets: rack-level anomalies are detected before they cascade. In transportation: sensor fusion on autonomous vehicles trains on the actual edge cases rather than averaged ones. In aerospace: flight-test instrumentation captures the moments engineers actually need to see.
The platform doesn't change between these. The data does.
The technologies underneath PredictiveGrid did not begin as a commercial product. They began as research artifacts at UC Berkeley, under the 2012 ARPA-E Open Innovation project that also produced the microPMU.
We commercialized the storage engine in 2017, hardened it for production at major North American utilities, and have been refining it ever since. The papers below define what the platform is and they have been examined, criticized, and built upon by the academic community for over a decade. That's the substance our claims rest on.
One technical note that matters for the broader claim: BTrDB was designed as a general-purpose time-series storage engine. The algorithm makes no assumption about what the timestamps describe. Its first proving ground happened to be sub-microsecond synchrophasor data, the most demanding real-world workload available at the time, but the same engine handles vibration data from a turbine, telemetry from a data center, and instrumentation from a flight test range with no architectural change.
We work with utilities, ISOs, national labs, research consortia, and other industries monitoring and operating critical real world infrastructure.