Keep every signal from every sensor, at full fidelity, queryable forever.
PingThings is the data layer for physical infrastructure. Built on a decade of research at UC Berkeley. Deployed across utilities, federal labs, and industrial operators. Engineered for the data your sensors actually produce, not the schema your historians can tolerate.
What the platform actually does.
Each capability gets a chapter: what it is, what physical systems require from it, and what the platform makes possible. Read in order, or jump to the one that matches your situation.
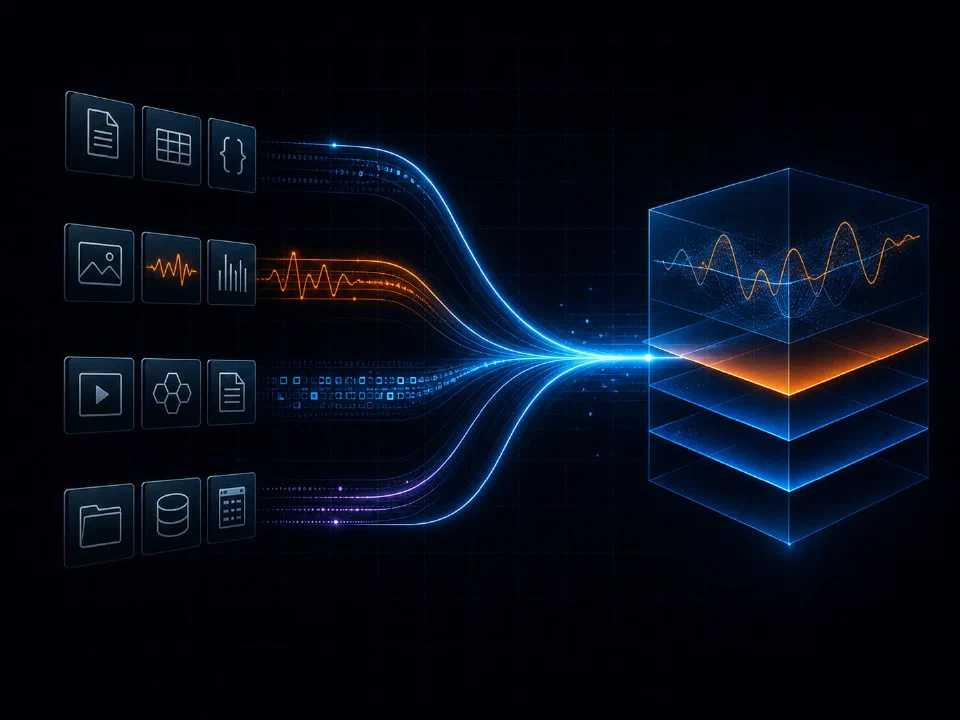
If it produces a measurement, the platform takes it.
Your fleet runs sensors from a dozen vendors across decades of vintages, sampling at rates from quarterly meter reads to megahertz waveforms, communicated over protocols that didn't exist when your historian was specified. The platform was built for that reality.
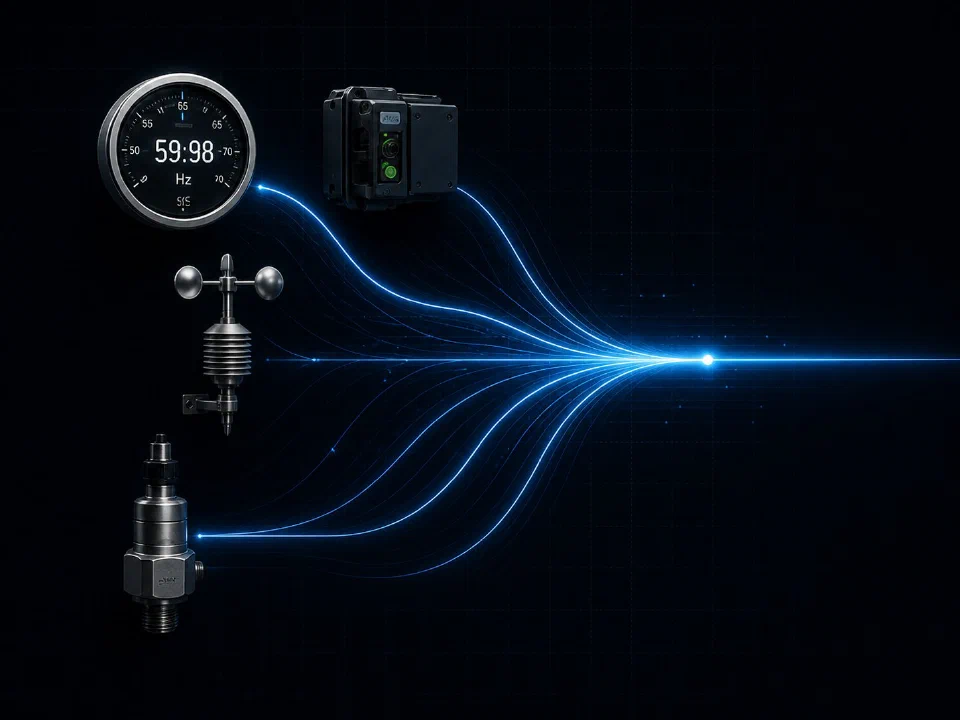
Anything that produces a timestamped value.
PMUs, digital fault recorders, point-on-wave instruments, SCADA RTUs, AMI smart meters, power quality monitors, relay event loggers, BMS sensors, vibration sensors, thermal cameras, weather stations, satellite-derived environmental data. The platform ingests them at native sample rate, in their native protocol, without forcing translation at the edge.
No replatforming. No data cleansing as a precondition. No schema harmonization at ingest. The platform takes what your fleet actually produces and resolves the rest at query time.
What the platform makes possible.
Sensor diversity stops being an integration problem and starts being a feature. New sensor classes onboard in hours rather than quarters. Acquisitions integrate without ripping out existing data infrastructure. Vendor changes don't trigger pipeline rewrites.
- 01 Native protocol support.C37.118, STTP, DNP3, Modbus, OPC UA, MQTT, BACnet, COMTRADE, PQDIF, and 30+ others. Add custom protocols without modifying core platform code.
- 02 Existing historian coexistence.PI Historian, OSIsoft, eDNA, custom systems. Read alongside, migrate over time, or run in parallel indefinitely.
- 03 New sensor classes onboard in hours.From "we just bought a thousand new units" to "we're querying their data" without an integration project.
- 04 Vendor-mixed environments by default.Multiple PMU vendors, multiple relay vendors, multiple AMI generations, all in one queryable substrate.
- 05 Schema-on-read.Don't pre-decide your data model. Resolve structure when you query, when you actually know what you're asking.
If your sensor produces a measurement, the platform stores it. The schema is your problem to solve later, or never.
Engineers spend more time finding data than analyzing it. That's not a tooling problem. It's an architecture problem.
Sample at the rate the physics demands, not the rate your storage can tolerate.
AMI samples at fifteen-minute intervals. SCADA polls at one to four seconds. PMUs sample at 30 to 120 hertz. Point-on-wave instruments sample at megahertz. The platform handles all of these in one substrate, at native rate, without forcing the lowest common denominator.
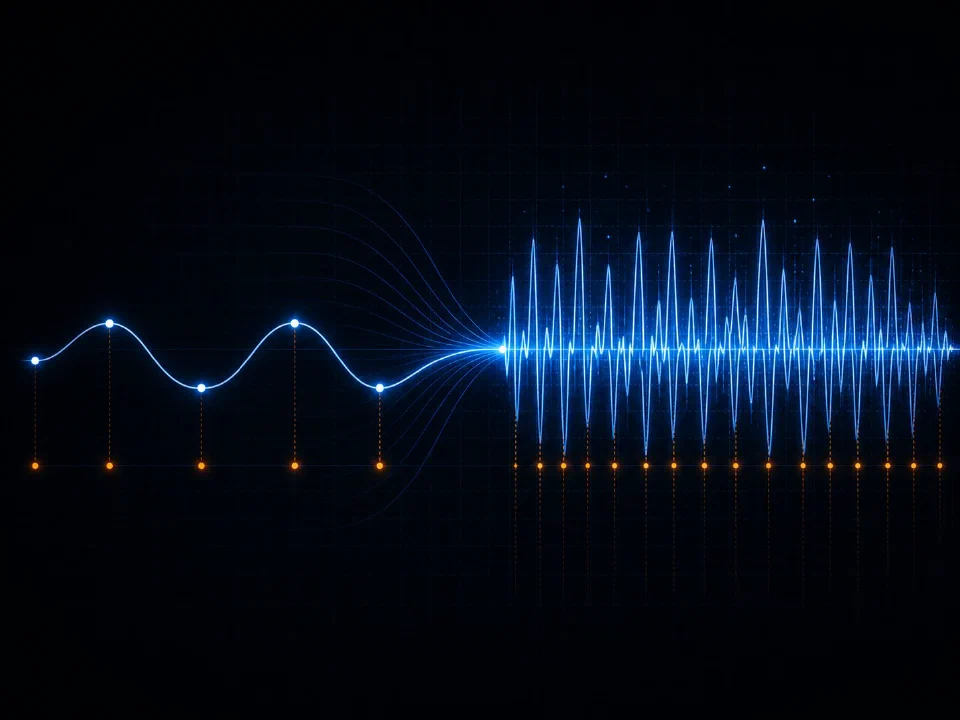
Different phenomena, different timescales.
A 15-minute meter read is enough for a billing reconciliation. It tells you nothing about a 200-millisecond inverter oscillation. A 1-Hz SCADA poll captures slow trends. It misses sub-cycle vegetation arcing. A megahertz waveform is overkill for asset trending and the only resolution that captures incipient discharge.
Your data layer's job is not to harmonize at the lowest rate. It's to preserve every phenomenon at the rate its physics requires.
What the platform makes possible.
Sample rate stops being a storage decision. Engineers can investigate at the resolution the question requires. AMI and PMU and waveform and point-on-wave coexist in the same query, time-aligned, queryable from years to microseconds.
- 01 Native rate preservation.No forced downsampling at ingest. The data your sensor produced is the data the platform stores.
- 02 Mixed-rate streams in one query.Pull AMI averages and waveform samples in the same time window. The platform aligns them.
- 03 Dynamic sample rates.Event-triggered recorders and burst-mode sensors change rate on the fly. Each segment is stored at its native rate and served as one continuous time series without human configuration.
- 04 Multi-resolution rendering.Pan from a decade of asset behavior to a sub-cycle event in the same view, without re-querying.
- 05 On-demand aggregation.Min, max, mean, count, standard deviation, computed at query time. Aggregates supplement the raw data, they don't replace it.
- 06 Storage architecture matched to the range.BTrDB compresses losslessly across nine orders of magnitude in sample rate without segmenting workloads.
The real world happens at its own speed. PingThings captures every detail.
Vegetation arcing resolves in sub-cycle events. Your historian samples every two seconds.
Real signals come in five different shapes. The platform handles all of them.
Operational telemetry isn't one type of data. It's continuous waveforms and regular samples and irregular events and digital states and sparse measurements, often describing the same physical phenomenon from different vantage points. The platform stores and queries all five types together.
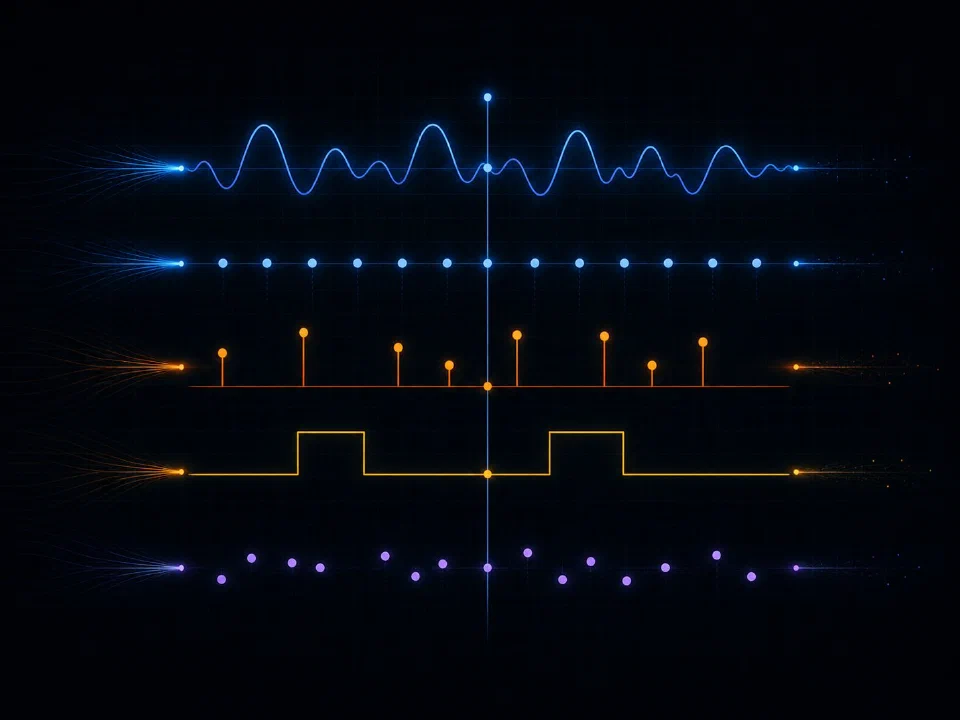
Five types, one event.
When a fault clears: the waveform spikes, the breaker opens, an alarm fires, the operator acknowledges, the dispatcher logs a note. Five different signal types, one physical event. Conventional architectures fragment them across waveform stores, time-series databases, event logs, state monitors, and ticketing systems. Engineers reconstruct events by querying four systems and reconciling timestamps by hand.
That fragmentation is a side effect of the storage layer, not a property of the data.
What the platform makes possible.
All five types share the same time-aware substrate. Cross-type queries are native. The waveform during a fault, the breaker state change, the alarm, the operator acknowledgment, and the manual reading two days later all show up in one query, in temporal order.
- 01 Continuous waveforms.Analog signals at native sample rate, lossless, with per-cycle fidelity preserved across years.
- 02 Regular samples.SCADA, AMI, PMU, sensor reads at fixed intervals. Co-stored with continuous data without separate infrastructure.
- 03 Irregular event streams.Faults, alarms, operator actions, equipment state changes. Sparse by nature, queried at the same temporal granularity as the continuous data they accompany.
- 04 Digital states.Breakers, switches, reclosers, mode changes. State transitions tracked, queryable as boolean signals or as event timelines.
- 05 Sparse measurements.Manual readings, infrequent surveys, third-party reports. Time-indexed and contextually attached to the assets they describe.
When the breaker opened, the waveform spiked, the alarm fired, and the operator clicked acknowledge. All of that is one event. The data layer should treat it that way.
Engineers spend $200K to $700K per workflow per year reconciling data that should never have been separated.
Your vendor stack changes every five years. Your data substrate shouldn't.
The old path is familiar: vendor lock-in, forced migrations, brittle exports, and historical data loss. PingThings ends that cycle.
Open where it matters.
Open in that we use best-of-breed open source wherever it works: Grafana, Jupyter, Apache Arrow, Kubernetes, the Python data science stack. Proprietary only where we can do meaningfully better. Open in that the protocols are standards-based, the data formats documented, the APIs public. Open in that the storage engine is fast enough to actually move utility-scale data around when you need to. It's part of why PredictiveGrid gets called the missing historian for Databricks.
None of that is accidental. It's how the platform stays useful as your stack around it changes. You can run PredictiveGrid alongside an existing historian indefinitely. You can migrate at your own pace. You can take your data with you if you ever leave. None of that requires our permission.
What the platform makes possible.
Vendor consolidation stops being a strategic risk. Mergers and acquisitions stop being multi-year integration projects. Sensor vendor changes stop triggering historian replacements. The data substrate outlives the vendor relationships built on top of it.
- 01 Open data formats.Apache Arrow on the wire. Parquet for bulk export. Standards-based ingest protocols. Your data is never trapped in proprietary binaries.
- 02 Standards-first protocols.C37.118, STTP, OPC UA, DNP3, MQTT, REST, gRPC. No proprietary wire formats required.
- 03 Open data formats.Parquet, Arrow, COMTRADE, PQDIF, CSV, JSON. Export anything, anywhere.
- 04 Coexistence with existing historians.Read alongside PI, eDNA, OSIsoft, custom systems. Migrate at your pace, or never.
- 05 Multi-vendor sensor environments.PMU diversity, relay diversity, AMI diversity. The platform doesn't care who made the hardware.
An aging monopoly historian increased its price again. Don't trap yourself in the past.
See the protocol list, the format list, and the integration surface.
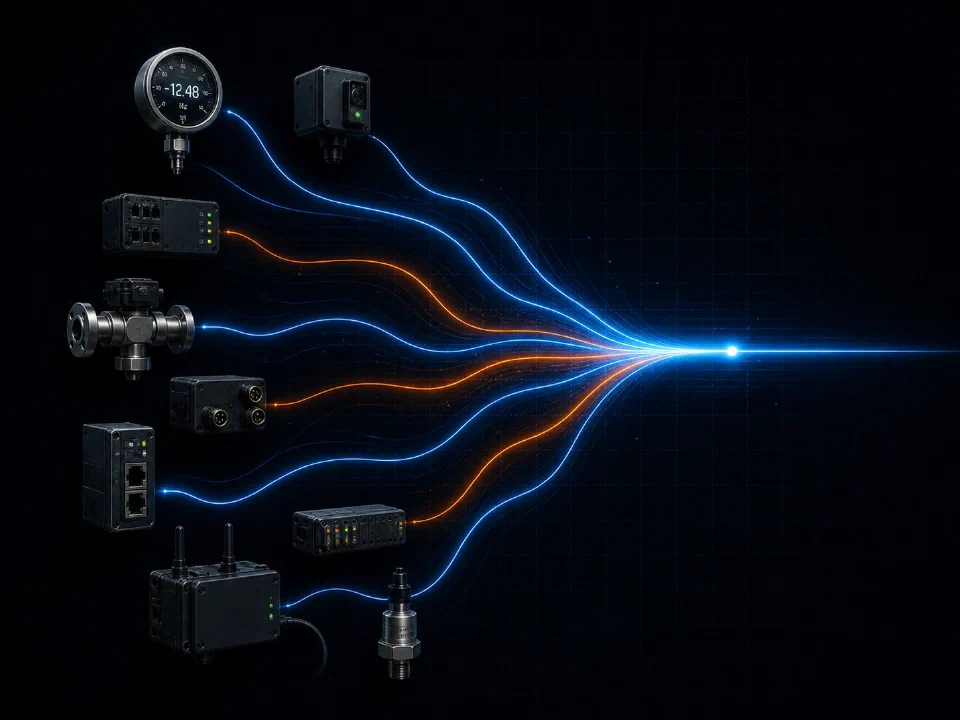
Streams in, files in, archives in. One queryable substrate.
Operational data exists in dozens of forms: live streams from substations, daily exports from billing systems, decades of archived COMTRADE files, weather datasets in NetCDF, satellite-derived environmental data in HDF5, and proprietary historian dumps no one knows how to read anymore. The platform takes all of it.
The data the way it actually exists.
Most operators have twenty years or more of historical data. Most of it is unreachable. It's on tape, in proprietary historian dumps, in CSVs no one indexed, in formats whose specs were never written down. The decision to leave it inaccessible was made one project at a time, never deliberately.
That history is also where your AI training data lives, where your asset baseline lives, where the precedent for unusual events lives. It's worth recovering.
What the platform makes possible.
Bulk historical data ingests at production rates. New formats can be onboarded without modifying core platform code. The historical archive becomes queryable at the same latency as live telemetry. Twenty years of operational data stops being a sunk cost and starts being a corpus.
- 01 Streaming protocols.C37.118, STTP, MQTT, OPC UA, DNP3, custom binary streams. Ingested at native rate.
- 02 File formats.COMTRADE, PQDIF, CSV, JSON, Parquet, Avro, Arrow, NetCDF, HDF5, custom binary. Ingested without translation.
- 03 Bulk historical backfill.Two million smart meters of historical data ingested in less than a day. Historian archives ingested in days, not years.
- 04 Custom format support.Add new file formats without modifying platform code. Bring proprietary historian dumps that no longer have working software.
Twenty years of operational data sitting on tape doesn't have to stay there.
Every utility board wants AI. The training data they need is the data sitting in storage they can't reach.
A timestamp and a value tell you nothing. Context is everything.
Sensors don't operate in isolation. They're attached to assets, located in geographies, tied to operating states, embedded in topologies. Without that context, raw measurements are just numbers. With it, they're investigations, predictions, and decisions.
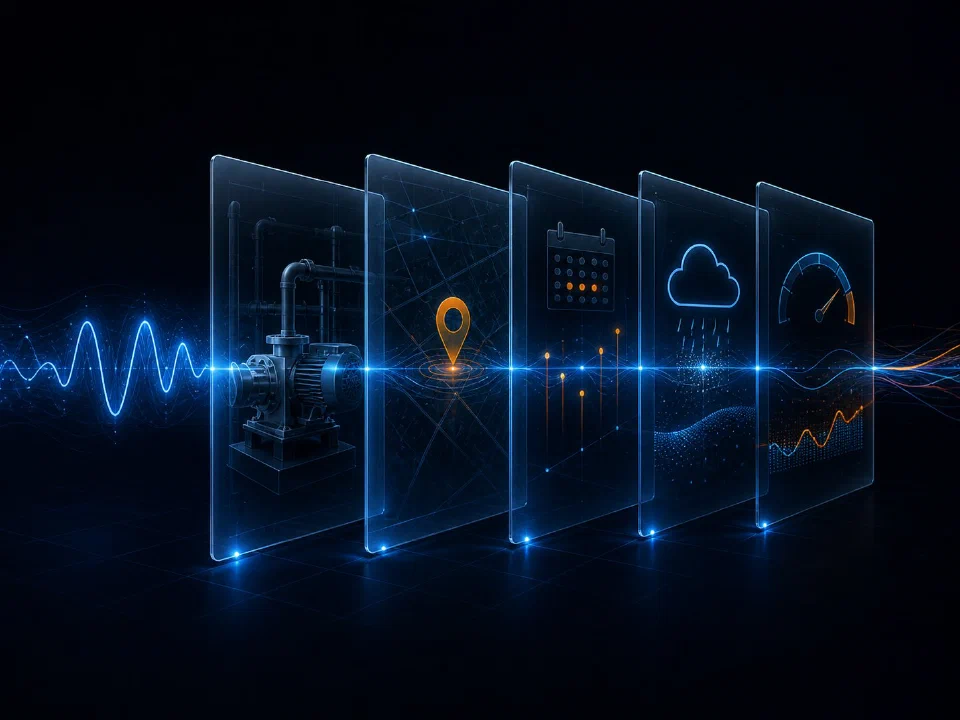
Stop maintaining sensor catalogs.
A typical operator has dozens of system-of-record databases tracking which sensor is on which asset, which asset is in which substation, which substation is on which feeder, which feeder serves which customers. The catalogs are out of date by the time they're queried.
The platform makes the context part of the data, not a separate system that engineers reconcile by hand.
What the platform makes possible.
Spatial queries become trivial. Investigations span context layers automatically. Cross-asset analysis stops requiring three days of database joins. Engineers ask questions in operational language, not in database schema.
- 01 Asset hierarchy as native object.Sensor, equipment, system, facility, grid. Query at any level. The hierarchy moves with the data.
- 02 Topology built in.Physical and logical structure. Electrical connections, network paths, communication paths. Trace an event through topology, not through manual lookups.
- 03 Geospatial context.Pull every sensor within five miles of an event. Run analyses by service territory, by feeder, by ZIP code, by weather grid cell.
- 04 Operating-state awareness.Know which assets were energized, in maintenance, in manual control, or in automatic mode at any timestamp.
- 05 Provenance and lineage.Where this measurement came from, what pipeline produced it, who derived it, what corrections were applied.
Ask "what was happening at the substation during the disturbance" and the answer should be one query, not three weeks of cross-referencing.
Asset deferral analysis depends on knowing what each asset has been through. The data exists. It just isn't connected.
A historian gets you to storage. The platform gets you to outcomes.
Storage is necessary. Storage is not enough. Most data layers stop at preservation: data lands, data sits, engineers export it elsewhere to analyze. The platform extends from ingest through visualization to operationalization, in one substrate, with no exports required.
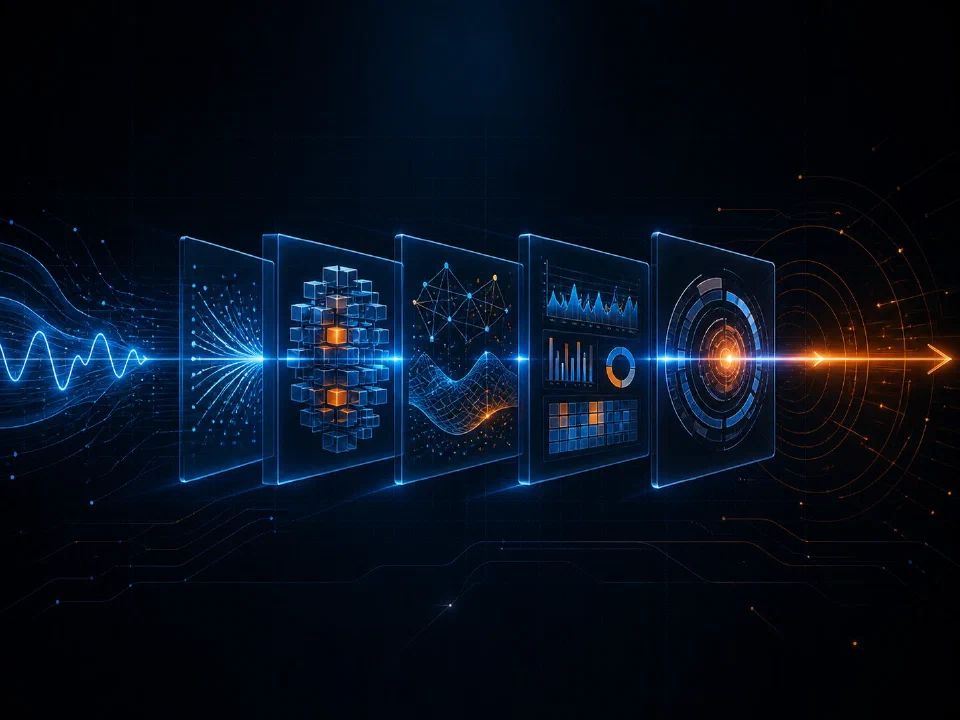
Six layers, one substrate.
Ingest. Preserve. Contextualize. Analyze. Visualize. Integrate. These are not separate products with their own data models. They are coherent layers of one platform, sharing one storage engine and one query path.
The distance between where the data lives and where the work happens is the distance most data architectures never close. The platform closes it by collapsing the layers into the same system.
What the platform makes possible.
Engineers analyze in place, in their notebook, against the live archive, at the resolution the question requires. ML pipelines train on full-resolution data without exporting petabytes. Operators see real-time and historical data in the same interface, queryable at the same latency.
- 01 DISTIL distributed analytics.Time-series operators that run at native sample rate, across petabytes, in real time. No data movement required.
- 02 Native notebook integration.Jupyter, Python, R. Engineers iterate where they already work, against the live archive, with versioned reproducibility.
- 03 Multi-resolution visualization.Pan from a decade to a microsecond in one view. Sub-50ms query latency at full resolution.
- 04 Streaming inference and derived streams.Run analytics continuously. Pipe results back into the platform as new signals.
- 05 Application surfaces.Dashboards, APIs, webhooks, partner integrations. The platform is a substrate, not a destination.
Close the gap between data and action.
See the technical foundation, the storage engine, and the analytics framework.
Real-world telemetry is messy. Good.
The data your sensors actually produce is full of late arrivals, dropouts, jitter, dynamic sample rates, sparse intervals, and corrections that arrive weeks after the original data. Every conventional pipeline breaks under these conditions. PingThings was designed for them.
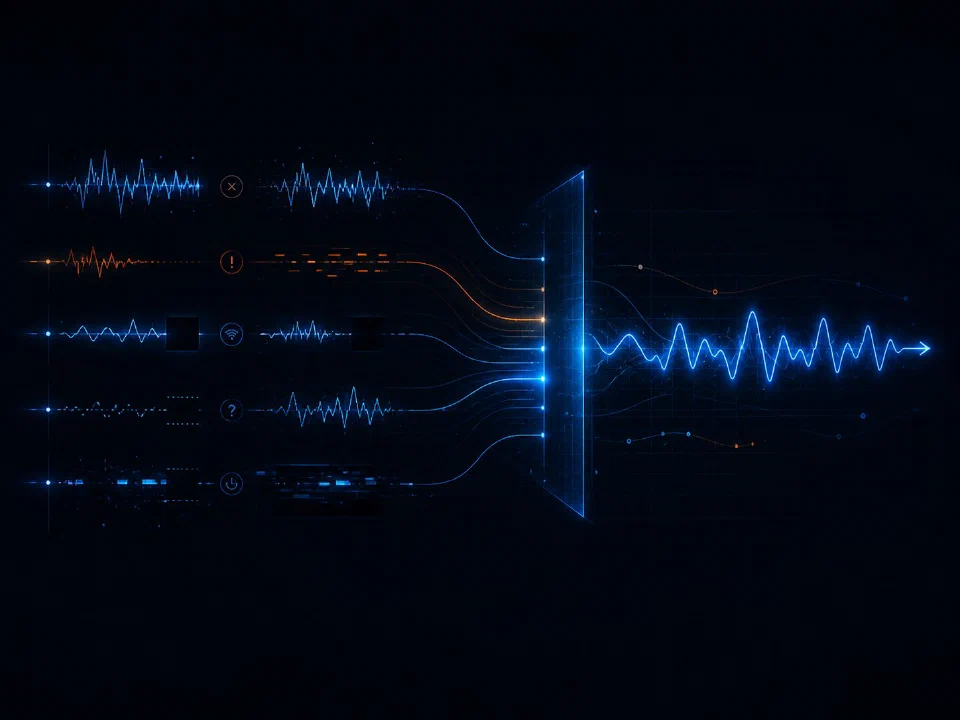
What sensors actually do.
In production, telemetry arrives late. Communications drop. Sensors recalibrate. Backfills come in days after the original window. Engineers correct old data and want both versions preserved. Sample rates change because someone reconfigured the device. Data arrives out of order because two paths converged.
Conventional pipelines treat all of this as exception handling. The platform treats it as normal operation.
What the platform makes possible.
Engineering teams stop maintaining ETL pipelines as their primary job. Real-world data quality stops blocking analysis. Corrections, enrichments, and backfills happen without breaking downstream queries or losing history.
- 01 Out-of-order tolerant.Data arriving late doesn't break queries or rebuild indexes. The platform absorbs and re-aligns transparently.
- 02 Versioned writes.Corrections and enrichments are tracked. Both the original reading and the corrected one are queryable. Audit trail preserved.
- 03 Backfill native.Bulk historical data ingestion runs alongside live writes without contention.
- 04 Dropout-aware.Gaps in data are visible, not interpolated away. Engineers see what was actually missing, not what a model imagined was there.
- 05 Variable sample rates.Devices reconfigure. Sensors fail and come back. The platform doesn't require uniform sampling, ever.
Real telemetry isn't tidy. The platform doesn't pretend it is.
Data silos exist because every team built a pipeline that broke under real conditions. Stop building pipelines.
Physical AI starts with the data you kept.
Every utility board wants AI. Most of their data is averages of averages, sampled at intervals coarser than the phenomena their models are trying to predict. PredictiveGrid was built for the resolution physical AI actually needs.
Why physical AI is different.
A model trained on 15-minute AMI averages cannot predict an inverter oscillation that develops in 200 milliseconds. A model fed downsampled SCADA cannot detect a vegetation contact arc that resolves in a sub-cycle event. Physical phenomena have characteristic timescales. If your data layer averaged through them, no amount of model architecture or training compute will recover what was lost.
Physical AI runs on signal, not summary. That's the prerequisite most data layers cannot meet. It's also the reason most utility AI initiatives stall in data preparation rather than model design: the training data the model needs is data that was never preserved.
What the platform makes possible.
PredictiveGrid preserves every cycle of every signal at native sample rate, time-aligned across heterogeneous sensor classes: PMU and AMI, SCADA and waveform, BMS and power quality, in the same query, at the same resolution they were captured. For ML and AI workflows, that translates into capabilities most teams have never had access to:
- 01 Training on the actual physics.Full-resolution waveforms, not their downsampled residue. Models learn from the phenomena, not from the artifacts of summarization.
- 02 Multivariate features across sensor classes.Power quality, frequency, voltage, asset state, all in the same time-aligned vector. Cross-domain learning without manual reconciliation.
- 03 Streaming inference at real-time latency.Sub-second query at full resolution means models can act on what's happening, not what happened last reporting interval.
- 04 Native notebook integration.Jupyter, Python, R, with distributed query through DISTIL. Engineers iterate in the environment they already use.
- 05 Versioned, lineaged training data.Reproducible model training, auditable predictions, regulatory-grade data provenance, all built into the substrate.
The model you train is only as good as the signal you preserved.
Every utility board wants AI. The data they need is the data they didn't keep.
Start with the problem in front of you.
PredictiveGrid meets teams where the pain is: unexplained events, brittle historians, inverter-heavy operations, messy telemetry, and data that should be useful but is not yet actionable.
For utilities · See PredictiveGrid in production
Bring us the data that breaks your current stack.
Show us the sensors, sample rates, formats, history, security constraints, and workflows that are giving you trouble. A few minutes is enough to know whether PredictiveGrid is the right substrate for your project.